
The data in the video above goes back to 1880, when we began collecting temperature records - culminating at today's 6,300 weather stations, ship- and buoy-based observations, and Antarctic research stations.
Until around the 1970s, you can see that the temperature fluctuates much like you'd expect, with the oranges and reds reflecting warmer temperatures, and the blues showing cooler years.
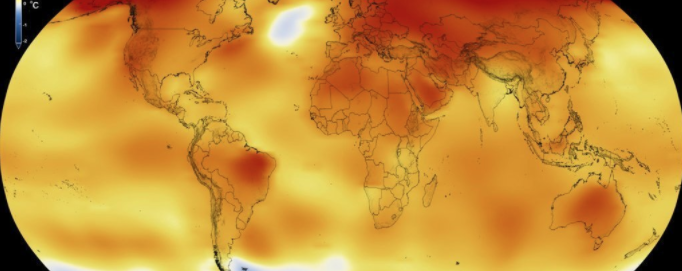
But from the 1980s onwards, there's very little blue left on the globe, and it's slowly covered in orange, yellow, and red, taking us right through to 2016.
The reference thermometer you can see in the top left-hand corner reflects the temperature difference (in degrees Celsius) between each year, and the mid-20th century mean - the '0' on the scale. More